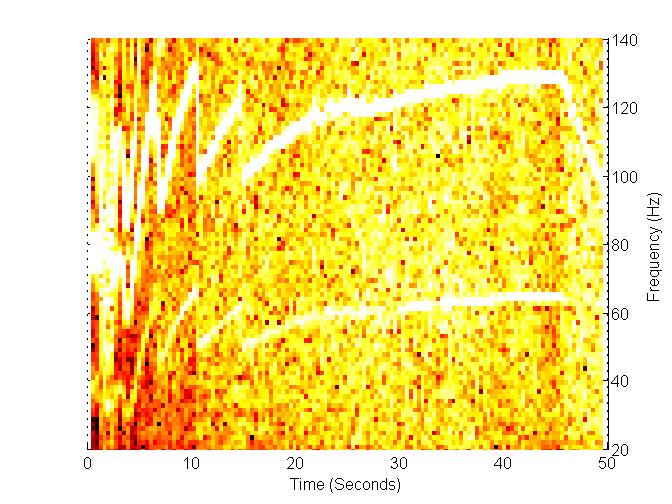
googling around I found some matlab scripts to create spectrograms. it plots in RPS (S=seconds), so you have to multiply by 60. There are a lot of harmonics and at least one sub harmonic in my data, so knowing what the rpm should be helps pick the correct line. Here is my 2nd run from the October El Mirage event. I topped out at 136 which by my calculations should have been ~7400 RPM. The plot shows a bright line at about 125 HZ which when multiplied by 60 yields 7500, so getting close. You can see the RPM variation in 1st gear due to it being too tall, clutch slip and bogging off the line. 2nd, 3rd and 4th are clear (only used 4 gears of a 5 speed due to available gearing options).
 OctRnd2GPaud
 by
mtiberio, on Flickr
here is the code I ran (extracts from 40 to 84 seconds in the input file foo.wav):
[data, fs] = wavread('foo.wav');
data = data(fs*40:fs*84);
winL = 32768;
win = hamming(winL);
nfft = winL;
[S,F,T,P]=spectrogram(data, win, winL/2, nfft, fs, 'yaxis');
surf(T,F,10*log10(P),'edgecolor','none');
axis tight;
view(0,90);
colormap(hot);
set(gca,'clim',[-80 -30]);
xlabel('Time (Seconds)');
ylabel('Frequency (Hz)');